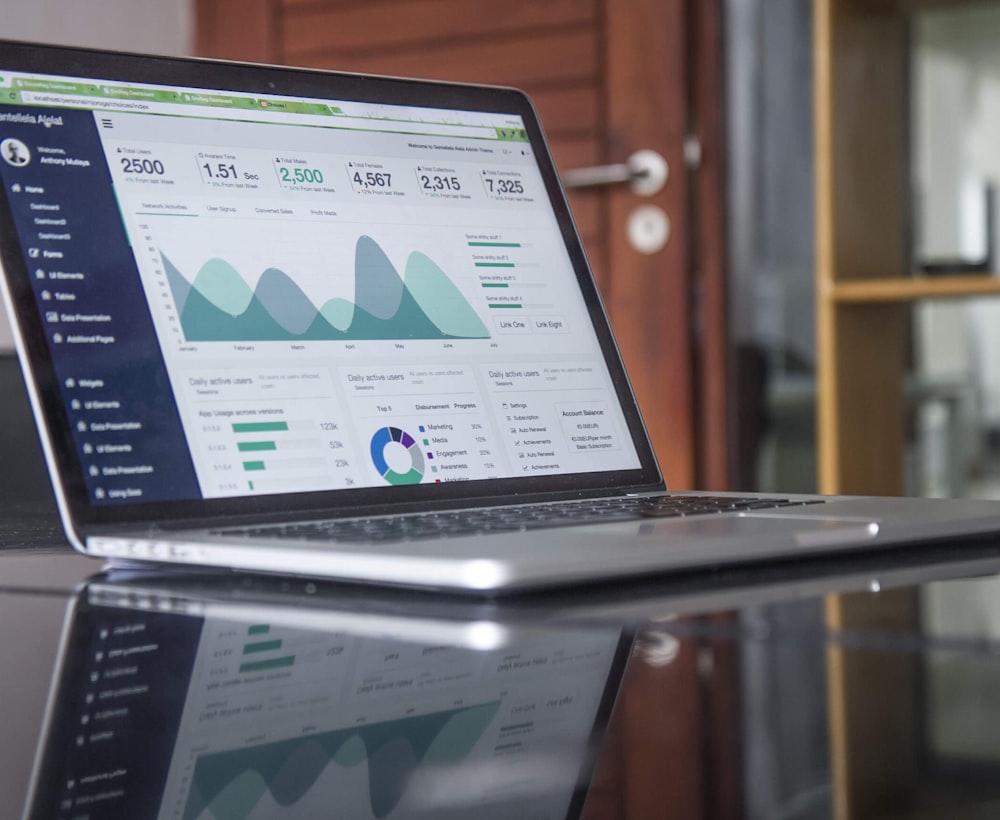
The numbers you've always wanted.
Lifetime value report
See the total revenue generated by each attendee across every event they've attended. Identify your most valuable customers and understand what drives them to come back.
Location report
Where are your attendees coming from? krowd maps attendance by zip code, city, and region, which is useful for radius targeting, venue selection, and sponsor pitch decks.
Demographic report
Aggregate demographic data across your attendee base: income distribution, age ranges, home ownership, marital status. Understand who your audience really is and communicate it clearly to sponsors.
Event P&L
Track revenue and costs per event to see your gross margin and know your breakeven. Understand which events are profitable and which ones need to change.
Sponsor ROI reports
Automatically generated after each event. Leads captured, booth traffic, dwell time, audience demographics. Professional enough to email directly to your sponsor the day after the event.
Better reporting with every event you run.
After your first event, you have baseline data. After your fifth, you have year-over-year comparisons. After your tenth, you understand your audience in ways that no competitor can replicate.
Every event adds to the foundation. krowd isn't just a tool for running your next event. It's the institutional memory of your business, stored and queryable forever.
A professional report the day after.
When an event ends, krowd automatically compiles the sponsor ROI report, with no manual assembly required. Send it the morning after the event while your competitors are still building spreadsheets.
What the sponsor report includes
- Total attendees and reach
- Leads captured at their booth
- Booth traffic and dwell time
- Audience demographic breakdown
- Social media and email impressions
- Comparison to prior events (where available)
Every event makes the reports better.
The data compounds with every event you run. The sooner you start, the richer your reporting gets. Start free today.